 Sign in with Google

Grades 9-12
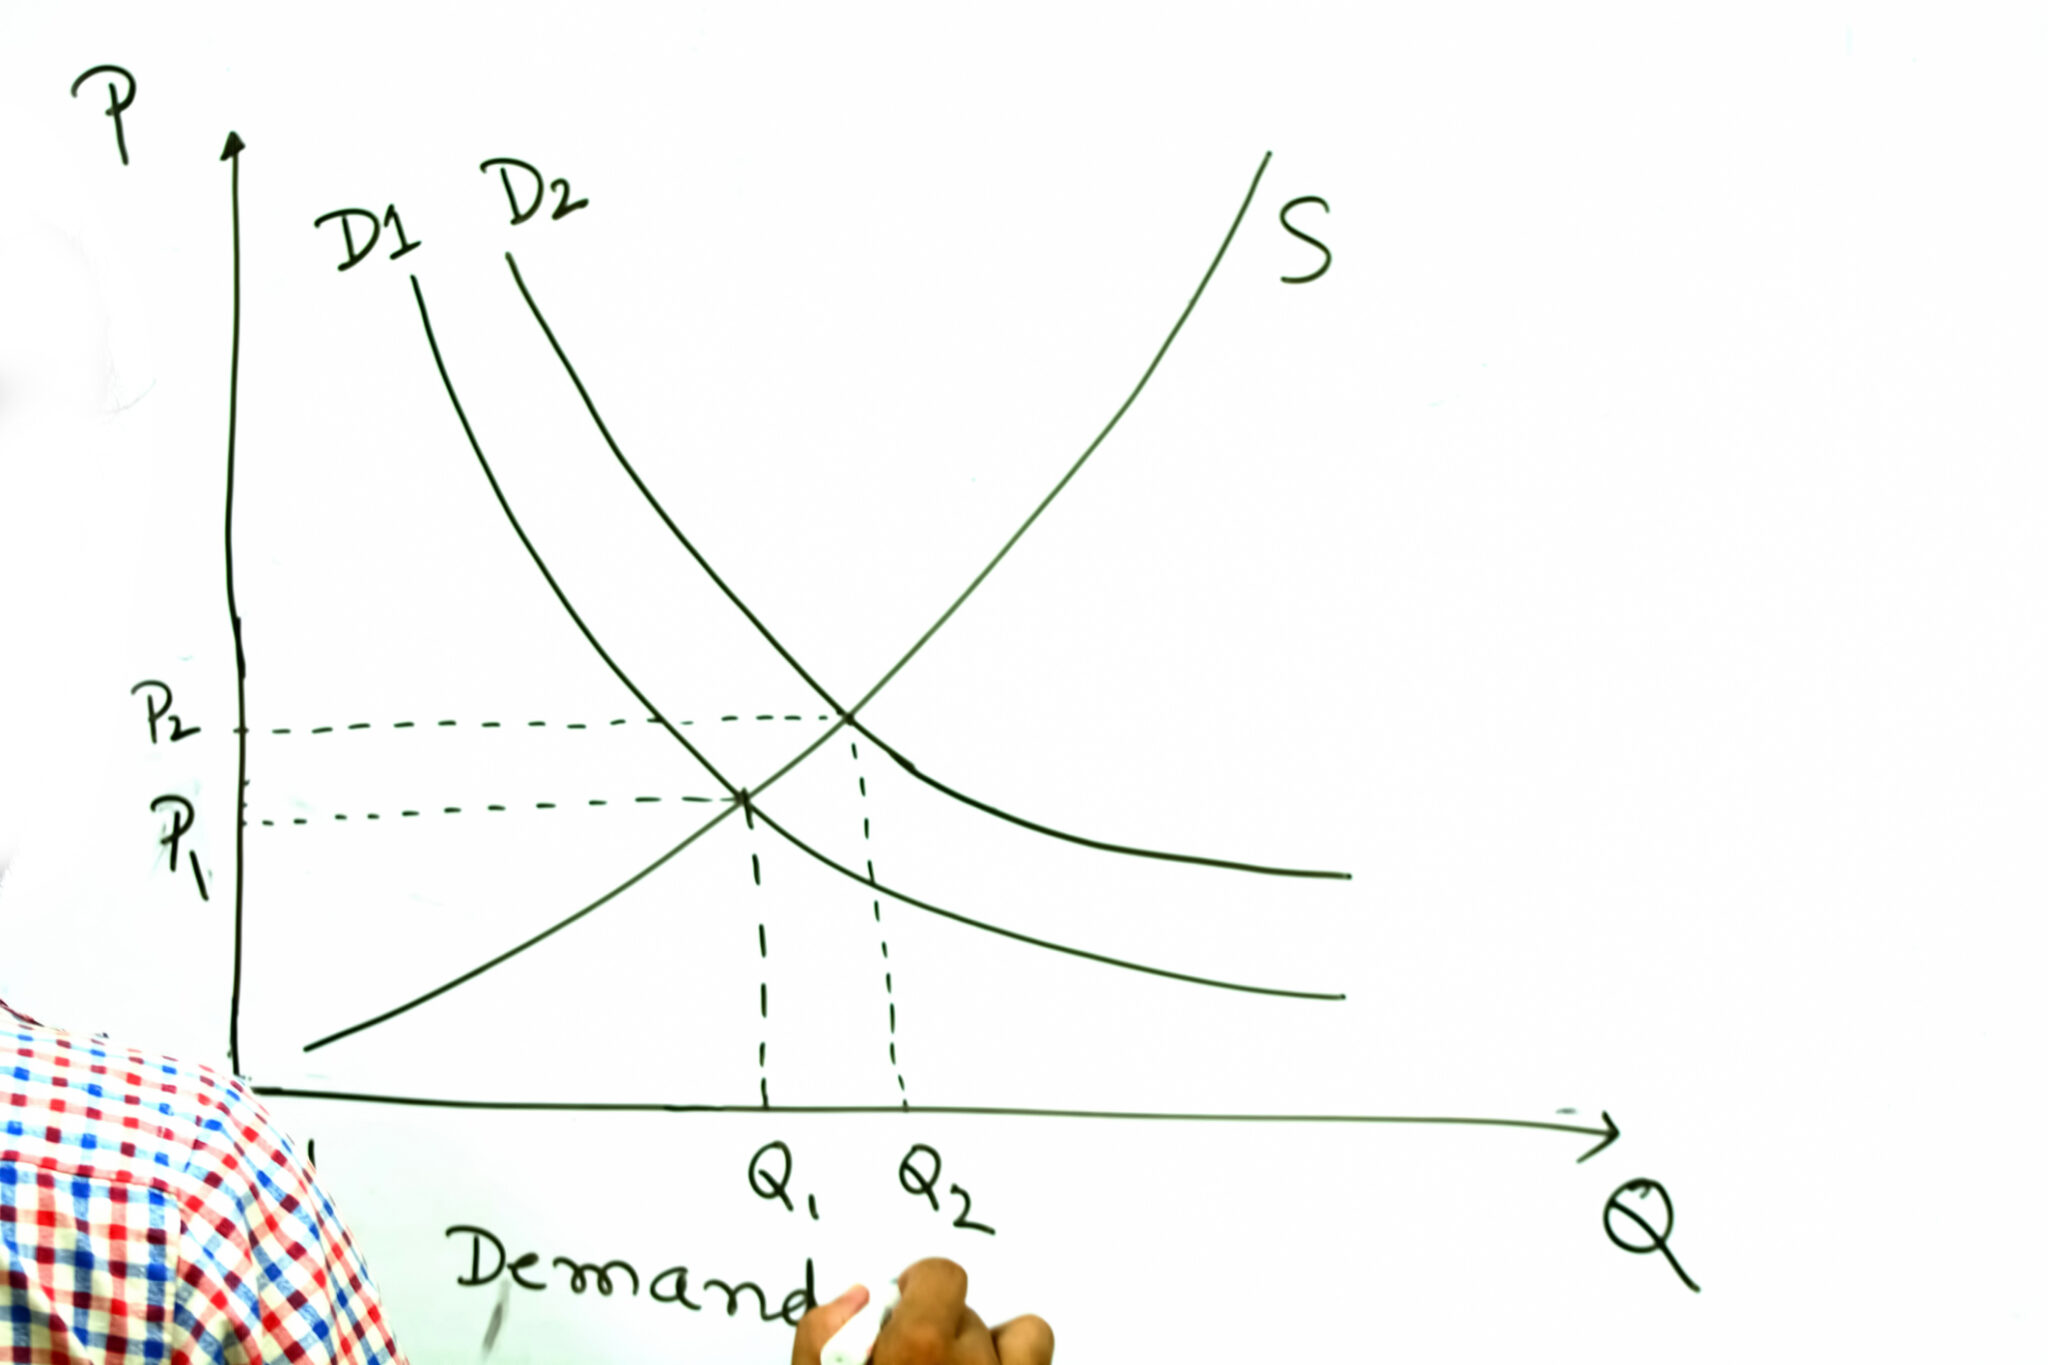
Supply and Demand - Game
In this economics game, students will play through a board game learning about supply and demand.
Key Concepts: Demand, Determinants of Demand, Determinants of Supply…